The SBA's New QoE Mandate Isn't the Story. The Underwriting Data Behind It Is.

Jeff Peze
7 min read
Starting October 1, 2026, SBA SOP 50 10 8.1 takes effect. Any SBA 7(a) acquisition loan priced at $3 million or more now requires a lender-ordered quality of earnings report and a Cash Proof reconciling bank activity to the tax return, and the debt service coverage floor rises to 1.25x on historical earnings only. Projections no longer count toward it. The streamlined small-loan underwriting path is gone entirely for any change of ownership, regardless of size.
Every SBA-lending blog, broker newsletter, and search-fund Slack channel has spent the last few weeks covering what changed. Almost nobody has asked why, or why now. We wanted the answer badly enough to go find it ourselves, because the official explanation didn't hold up.
What the SOP actually says, and why it's not enough
SBA's stated rationale, in Appendix 15 of the new SOP, is that change-of-ownership lending has grown into one of the largest categories in the 7(a) program and carries risks other segments don't: untested new ownership, seller-reported earnings that may be optimistic, uncertainty about whether the numbers survive the transition to a new operator.
That's true. It's also generic enough to have been written at almost any point in the last ten years. It explains why SBA might tighten acquisition underwriting in general. It doesn't explain why the agency moved now, with this specific mechanism, requiring a report the borrower isn't even permitted to commission on their own behalf.
We didn't think the answer was in the SOP text. We thought it was in the loan data.
What we did
SBA publishes loan-level FOIA data on every 7(a) loan approved since 1991, including the approval date, the charge-off date where applicable, and the gross charge-off amount. We pulled the two most recent files (approvals FY2010-2019 and FY2020-present, current through mid-2026) and built a dataset of every loan with a recorded charge-off.
Most public commentary on "rising SBA charge-offs" reads the topline dollar figure by the fiscal year a loan failed. On that basis, the picture looks fine. Full-year 2024 charge-off dollars came in nowhere near the 2016 peak, and the aggregate number has genuinely leveled off in complete-year data for 2025.
That's the wrong number to read in isolation. It blends a large wave of pre-COVID loans finally failing on a delayed timeline (their charge-offs paused for a couple of years under CARES Act relief, so they're showing up years later than they normally would) with a much smaller but faster-growing wave of newly originated loans failing fast. Averaged together, the newer problem is invisible.
So instead we sorted every charge-off by the fiscal year the underlying loan was approved, not the year it failed, and measured what share of that vintage's originated dollars had charged off within 36 months, correcting for the fact that newer vintages haven't had as much time to season.
Finding 1: loans made in 2022 and 2023 are failing early, at rates the portfolio hasn't seen since before COVID
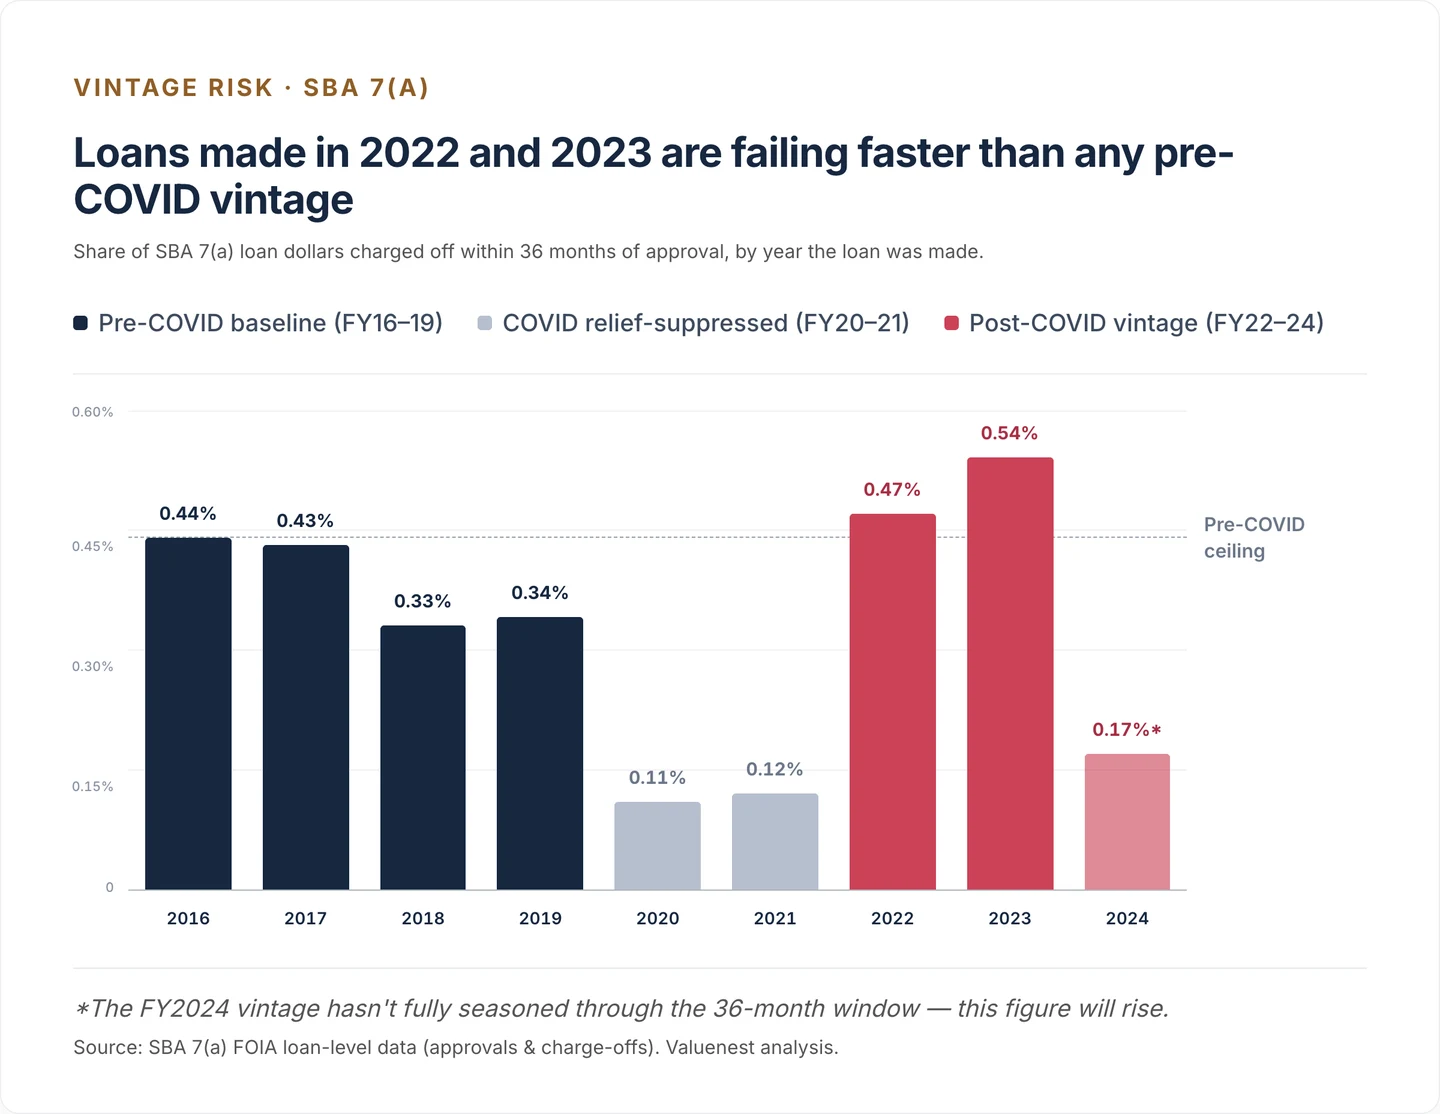
Loans approved in FY2016 through FY2019 charged off within three years at a rate between 0.33% and 0.44% of dollars originated. That's the pre-COVID baseline, and it held steady across four separate vintage years.
Loans approved in FY2020 and FY2021 look artificially healthy, down near 0.11% to 0.12%. That's not stronger underwriting. CARES Act payment relief paused distress signals on existing loans for roughly six months, which delayed defaults rather than preventing them, and it's exactly this delayed wave that's still inflating today's topline charge-off numbers with old, not new, loans.
Loans approved in FY2022 and FY2023 broke through the pre-COVID ceiling: 0.47% and 0.54% respectively, both meaningfully above anything the pre-pandemic portfolio produced. FY2024's vintage, even though it hasn't finished seasoning through the full three-year window yet, is already tracking in the same direction and will almost certainly climb further as more of that cohort ages.
We're not the only ones who found this
An internal SBA risk analysis, reported by Barron's in early 2025, measured the same underlying problem a different way and landed on the same conclusion. Using an 18-month early-default window across the whole 7(a) book rather than our vintage-based approach, the agency's own analysis found the early-default rate tripled between 2022 and 2024, to above 1%. Delinquencies over the same stretch rose from roughly 1% to 2.5%.
More directly still: SBA's own FY2024 financial filing raised its loss forecast by $525 million, citing expected losses specifically on loans made in 2023 and 2024. That's SBA, in its own official numbers, independently pointing at the exact two vintage years our analysis flagged.
The stress has shown up in bank failures, too. Community Bank & Trust in West Georgia failed in 2026, the second US bank failure of the year, costing the FDIC's Deposit Insurance Fund roughly $100 million, with impaired SBA loans loaded on its books. The National Association of Government Guaranteed Lenders' CEO, Tony Wilkinson, summarized the era bluntly: an unacceptable number of loans made during the "do-what-you-do" period are just proving to be not that good.
Separately, the program's finances have been squeezed from the fee side too. SBA cut 7(a) guarantee fees starting in 2023 to expand access, and by 2024 loans under $1 million carried no guarantee fee at all. That reduced the program's fee revenue by more than $100 million year-over-year, right as defaulted-loan purchases the agency had to fund rose from $570 million in FY2021 to $1.6 billion in FY2024, pushing the historically self-funding program cash-flow negative for the first time in over a decade. A Senate Small Business Committee hearing examined the reversal directly, with lawmakers raising concerns about both the fee cuts and the broader loosening of underwriting standards that preceded it.
Finding 2: the newest, weakest vintage is becoming the dominant share of what's failing
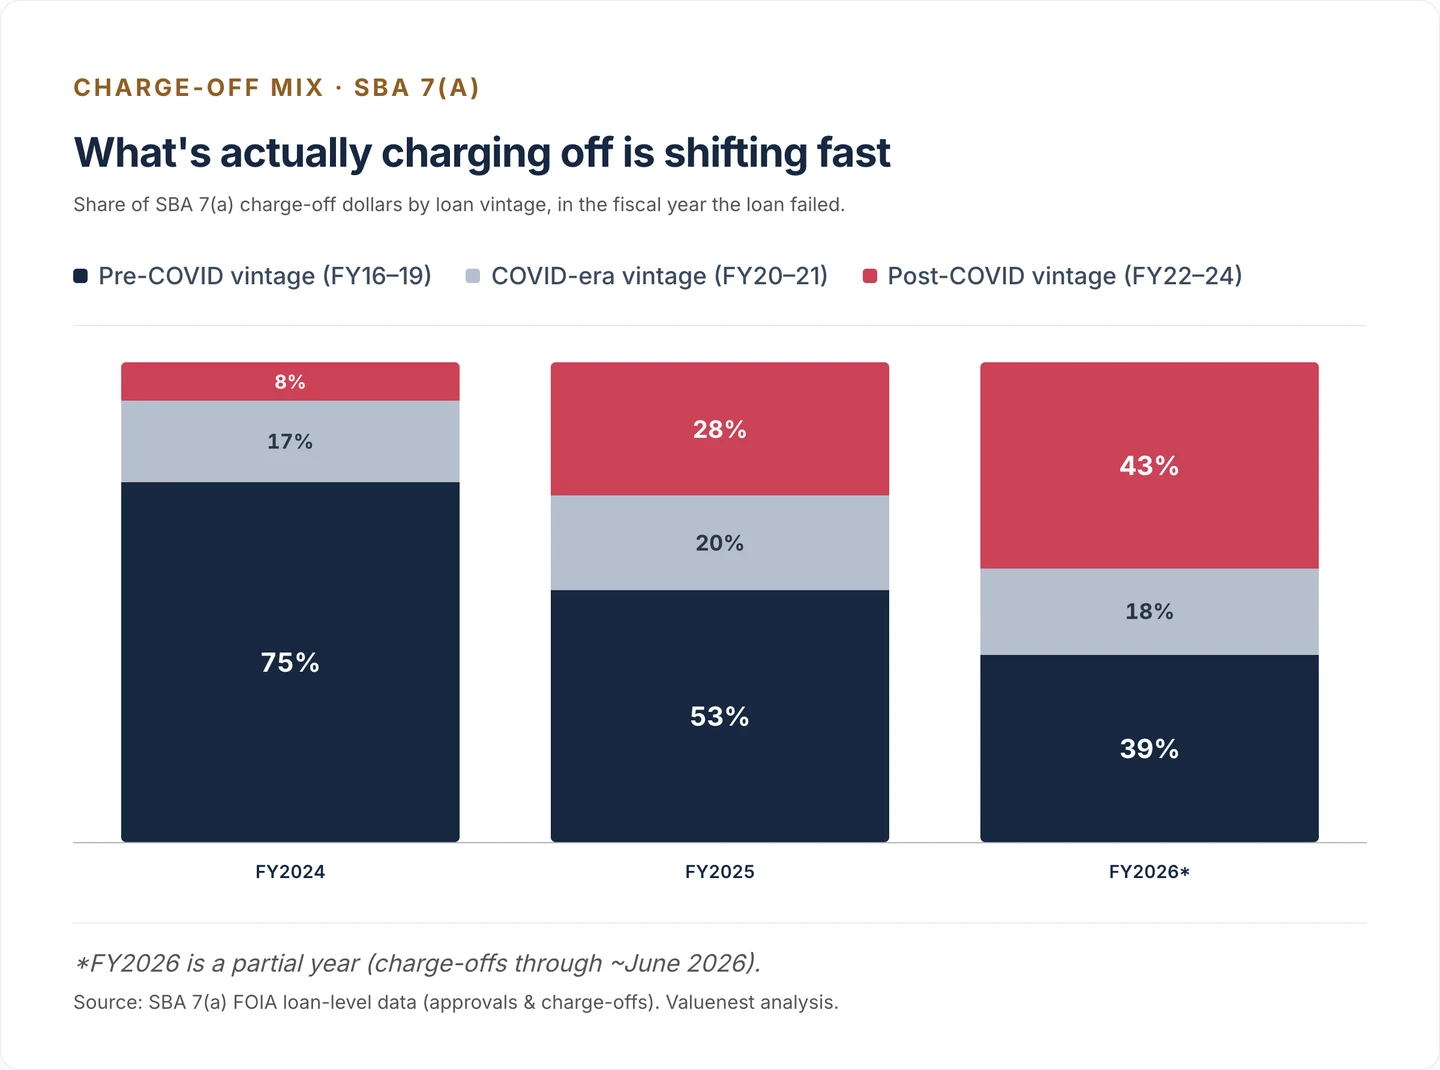
Two years ago, loans from the FY2022-2024 vintage were a rounding error in the total charge-off number, about 8% of dollars. This fiscal year they're pushing 43%. The pre-COVID and COVID-era vintages that used to dominate the aggregate figure are aging out of the system, and what's replacing them is both worse and arriving faster than the topline number lets on.
That composition shift is the actual mechanism behind SOP 50 10 8.1, even though SBA's own text frames the change in terms of category-level risk rather than a specific default surge. Search and acquisition activity stayed hot straight through the 2022-23 rate-hiking cycle. Debt got done on those deals anyway, often against earnings that hadn't been independently tested. The failures from that window are only now reaching the age where they show up as charge-offs, which is exactly why the aggregate figure still looked fine for years while the underlying trend was already deteriorating underneath it.
This isn't only an SBA problem
Every one of these loans sits inside a larger capital stack than the SBA's own numbers capture. There's usually a seller note behind the bank debt, sometimes structured with an earn-out, and often a minority equity investor who wrote a check to help a first-time buyer close the deal. None of those parties show up in SBA's charge-off data. When the senior loan fails, they are frequently the ones left holding the loss, sitting behind the bank in the priority stack with far less protection than the guaranteed lender.
Behind the capital stack are the people who depend on the business itself: employees who need it to keep running, and vendors and customers who built a relationship with it long before a private buyer and a bank got involved. Nobody is systematically tracking what happens to them when a 2022 or 2023 vintage acquisition loan goes bad. That's a considerably bigger question than SBA's own balance sheet, and it's one we intend to come back to.
What this means if you're buying, selling, or advising right now
If you're evaluating a $3 million-plus acquisition after October 1, the lender's quality of earnings report is not a formality to route around. It's a test built for a problem that's been building since 2022, and it will use the target's actual historical earnings, not the growth story in the deck, to decide whether the deal clears. Getting an independent read on earnings quality before you're in underwriting, not after, is the difference between repricing a deal on your own terms and having a lender's report do it for you.
That's the same discipline we built the Market Readiness Assessment around from day one: score a deal against what the numbers can actually support, before the market or a lender finds the gap for you.
Sources
- SBA SOP 50 10 8.1, "Lender and Development Company Loan Programs," effective October 1, 2026
- SBA Information Notice 5000-880695, "Issuance of SOP 50 10 8.1," August 14, 2026
- SBA 7(a) & 504 FOIA loan-level dataset, data.sba.gov, accessed August 2026
- "SBA Loans Are Going Bad. An Internal Risk Analysis Gives Details," Barron's, February 26, 2025
- "Georgia bank saw increase in problem SBA loans before it failed," American Banker, May 8, 2026
- SBA Report: Small Business Administration Loan Program Performance (Charge-Off Amount by Program), data through June 30, 2025